Navigating the Dashboard
The Xping Dashboard provides multiple views for monitoring your test suite. After integrating the SDK and running tests, you'll see your data appear in the dashboard.
Home Dashboard
The home page displays four tabs for different views of your test data:
Test Sessions Tab
Shows test run uploads from your CI/CD pipeline or local development:
- Session Information: When tests were executed and uploaded
- Execution Statistics: Total tests, passed/failed counts, success rate
- Duration: How long the test session took
- Environment: Where tests ran (CI, Local, Staging, etc.)
- Framework: Test framework and .NET runtime version
Projects Tab
Groups tests by project (test assembly):
- Project Name: Your test project/assembly name
- Total Tests: Number of tests in the project
- Statistics: Pass/fail rates and execution counts
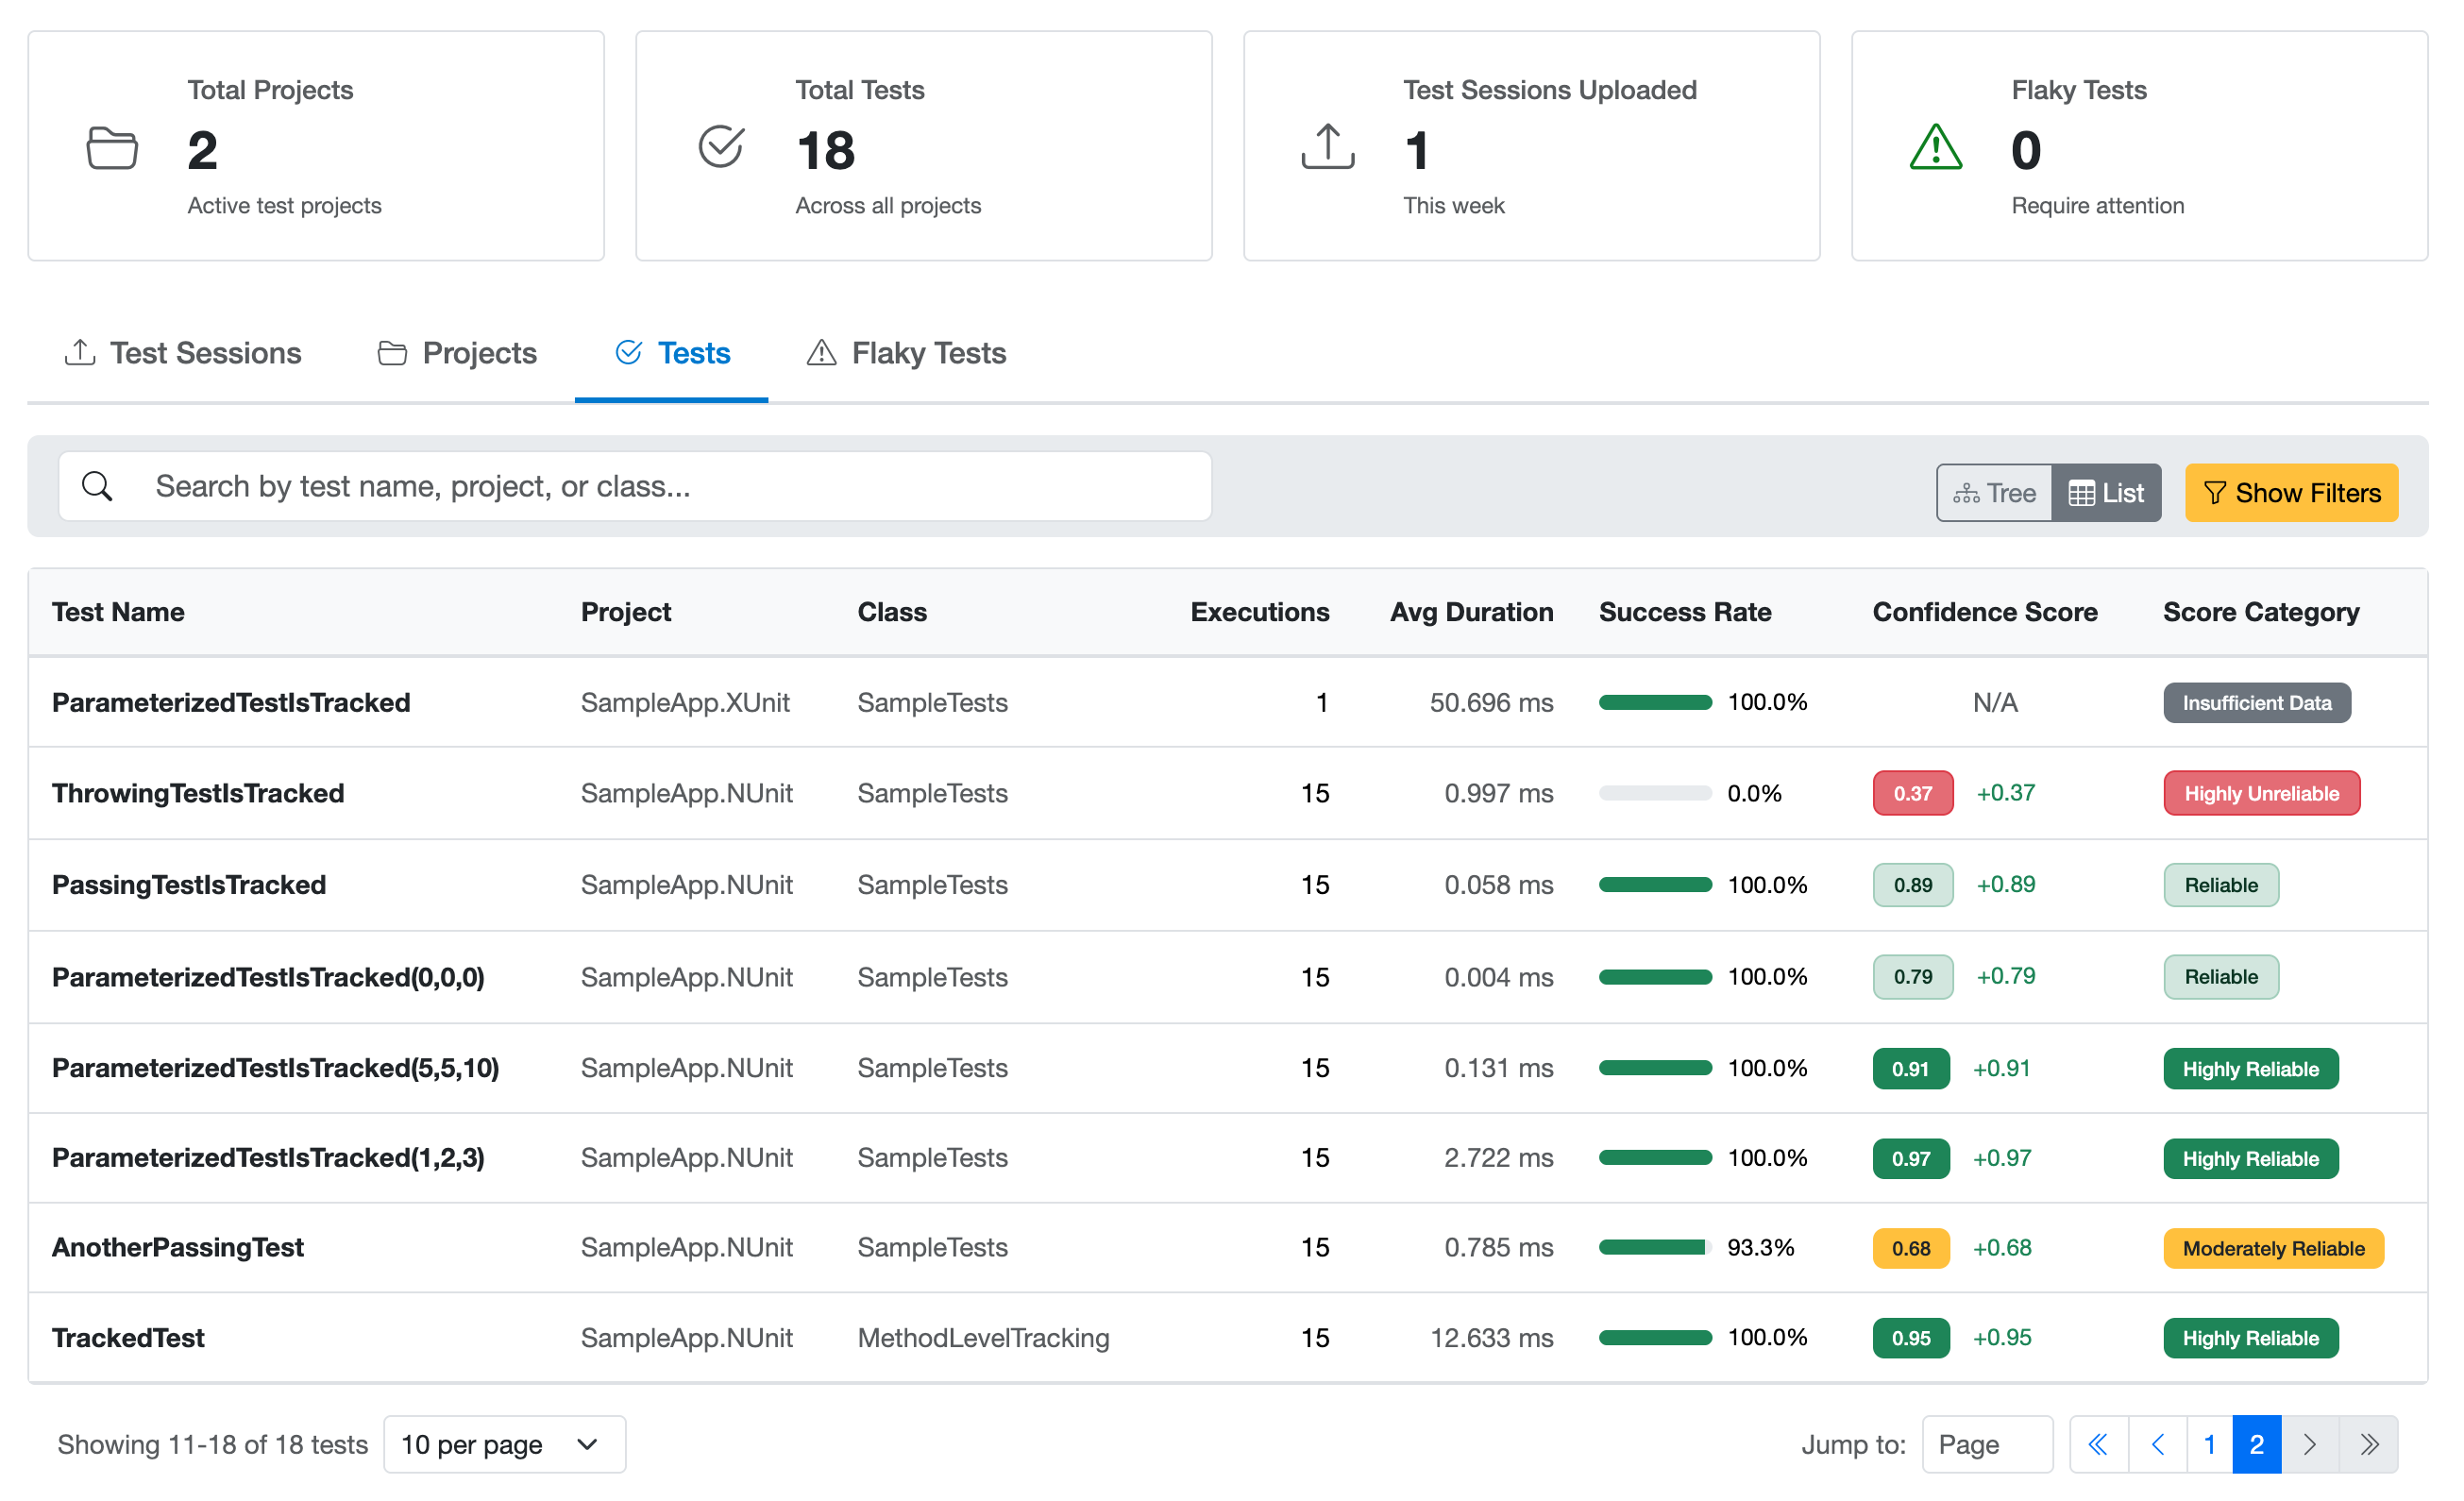
Tests Tab
The primary view for all your tests. Available in two modes:
List View - Displays all tests with:
- Test Name: Method name and quick access link to details
- Project & Class: Organizational context
- Total Executions: How many times the test has run
- Average Duration: Typical execution time
- Success Rate: Percentage of passing executions with visual progress bar
- Confidence Score: Numerical score (0.00-1.00) with colored badge
- Score Category: Badge showing "Highly Reliable", "Reliable", "Moderately Reliable", "Unreliable", or "Highly Unreliable"
Tree View - Hierarchical display organizing tests by:
- Project → Namespace → Class → Test Method
- Makes it easy to navigate large test suites and see organizational structure
- All the same metrics as list view, organized hierarchically
Flaky Tests Tab
Focuses on tests that need attention:
- Filters to show only tests with low confidence scores (< 0.60 threshold)
- Same columns as Tests tab
- Helps you prioritize reliability improvements
Filtering and Searching
All tabs provide filtering capabilities:
- Search: Find tests by name, project, or class
- Score Category Filter: Filter by reliability level
- Success Rate Range: Show tests within specific pass rate ranges
- Confidence Score Range: Filter by confidence score thresholds
- Execution Count Range: Find tests by how often they've run
- Last Executed After: Show recently run tests
- Sorting: Sort by any column (name, executions, success rate, confidence score, duration)
- View Mode (Tests tab only): Toggle between tree and list views
The Test Detail View
Clicking on any test in the dashboard takes you to a detailed analysis page. This page provides comprehensive insights about individual test behavior.
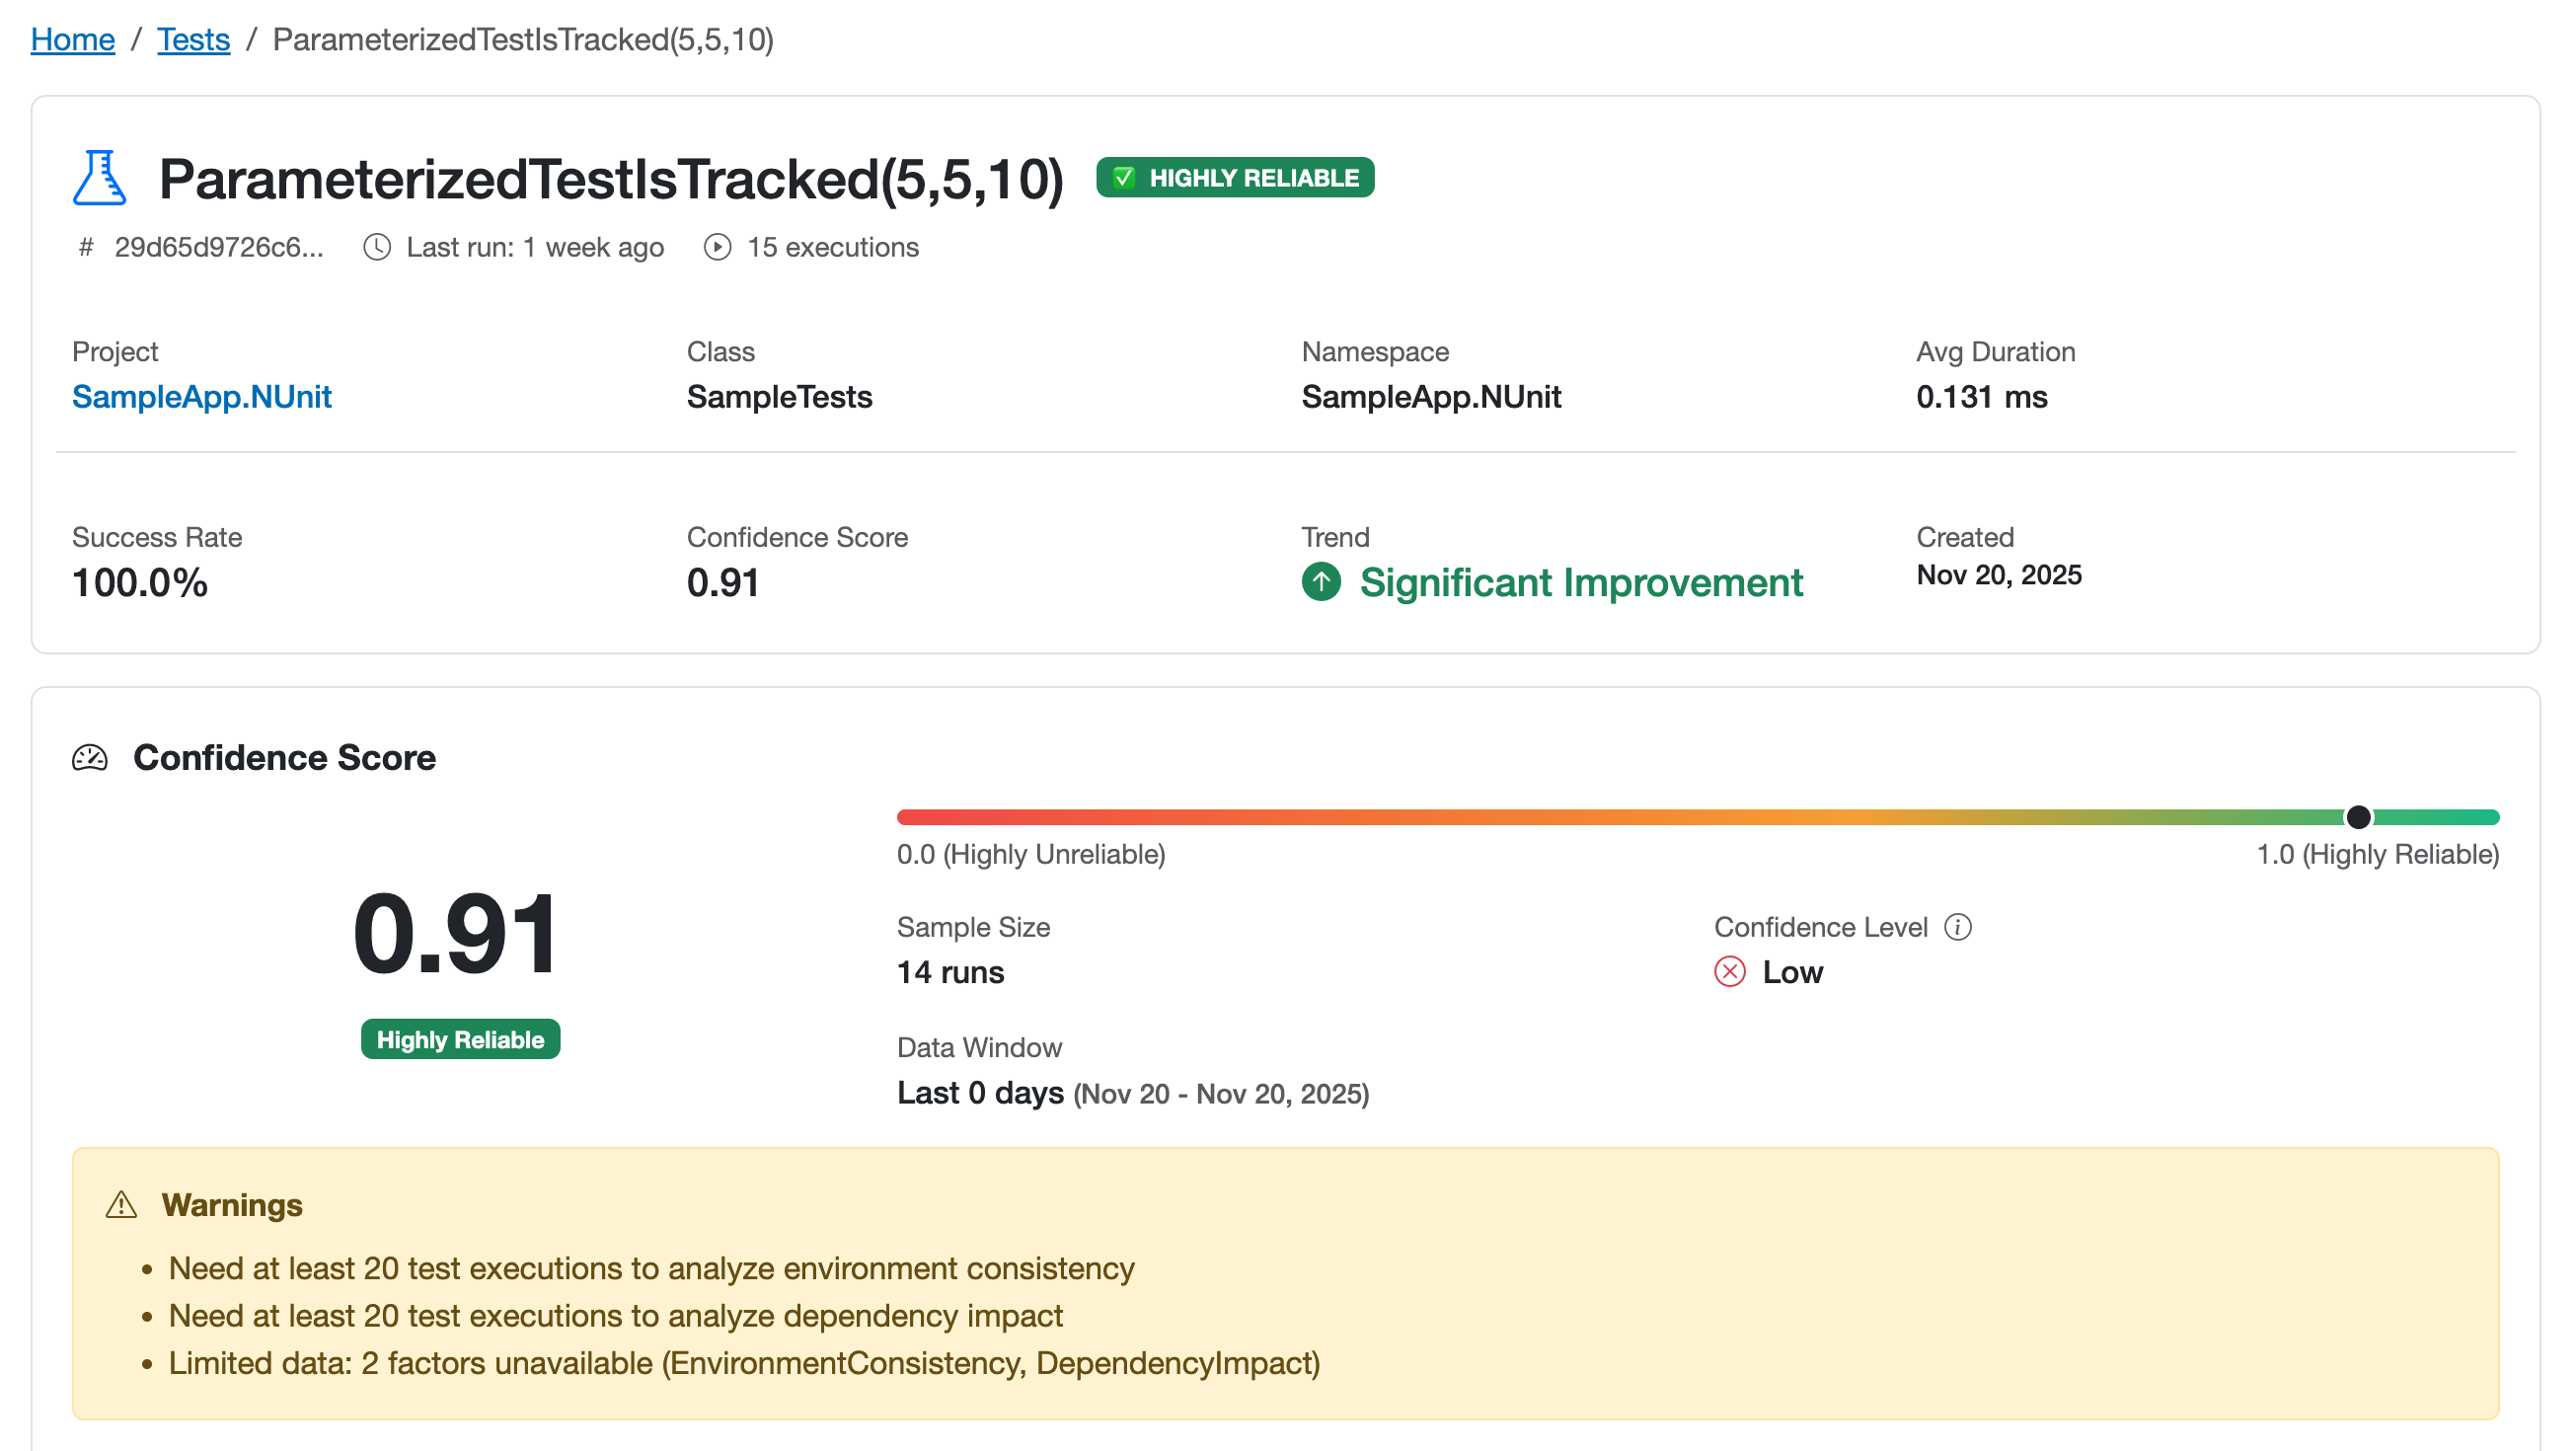
Overview Section
- Test Header: Full test name, project, and class information
- Primary Metrics Card:
- Current confidence score with visual badge
- Confidence level indicator (sample size context)
- Success rate with visual progress bar
- Total executions count
- Average execution duration
- Last execution timestamp
Confidence Score Breakdown
A detailed view showing how each factor contributed to the overall confidence score:
- Factor Names: Pass Rate, Execution Stability, Retry Behavior, etc.
- Individual Scores: Each factor's score (0.0-1.0)
- Visual Progress Bars: Color-coded based on score (green/yellow/red)
- Sample Size: How many executions were analyzed for each factor
- Confidence Level: Statistical confidence for each factor
This breakdown helps you understand why a test has a particular score.
Related: For details on what each factor means, see Understanding Confidence Scores.
Execution History
A timeline of recent test executions showing:
- Outcome: Pass/fail status with visual indicators
- Duration: Execution time for each run
- Environment: Where the test executed (CI, Local, etc.)
- Timestamp: When the test ran
- Attempt Number: Whether it was a retry
Environment Analysis
Compare test behavior across different execution environments:
- Per-Environment Scores: Separate confidence scores for Local, CI, etc.
- Pass Rates: Success rates in each environment
- Sample Sizes: Number of runs in each environment
- Trends: Score changes within each environment
This helps identify environment-specific issues.
Flaky Detection Analysis
If the test is flagged as flaky, this section provides:
- Flakiness Category: Type of flakiness detected (Timing, Environment, Concurrency, etc.)
- Root Cause Analysis: Specific indicators found
- Recommendations: Actionable suggestions for fixing the issue
- Confidence: How certain the system is about the categorization
Related: For more on flakiness patterns, see Common Flaky Patterns.
Test Metadata
All collected information about the test:
- Test framework and version
- Categories and tags
- Custom attributes
- Description (if provided)
See Also
- Understanding Confidence Scores - Learn what confidence scores mean
- Interpreting Test Results - How to use the data to make decisions
- Identifying Flaky Tests - Find unreliable tests using the dashboard